Core PCE Rises, Reigniting Pressure on the NASDAQ!
The Core PCE Price Index rises 0.4%, the highest in more than 12 months. As a result, the stock market declines more than 0.35% as the higher inflation data may force a more hawkish Federal Reserve. Previous markets were expecting the Core PCE Price Index to remain at 0.3%.
Why is the Core PCE Price Index vital for the Federal Reserve?
The Core PCE (Personal Consumption Expenditures) Price Index is crucial for the Federal Reserve because it serves as the Fed’s preferred measure of inflation. Here’s why it’s so important:
- Excludes Volatile Components - The Core PCE excludes food and energy prices, which are often volatile.
- Tied to Consumer Behaviour - Unlike the CPI, which measures a set basket of goods and services, the PCE reflects what people actually spend, including third-party payments. Therefore, if something is not in demand, it will not be included in the index.
- More Accurate - the Core PCE Price Index is deemed to be more accurate as it only includes assets which are being bought. For example, spending patterns during an economic boom are different to during a recession.
Economic Developments Impacting The Stock Market
Traders remain focused on new trade policy statements from US President Donald Trump. Yesterday, the president made an official 25% tariff on all imported cars and light trucks, a move expected to primarily impact German and Japanese automotive sectors. The tariffs, set to take effect on April 2nd, are projected to generate over $100 billion in annual revenue, according to White House aide Will Scharf.
However, the news continues to deepen the fear of a trade war, higher inflation and a hawkish FOMC. As a result, the US stock market continues to decline for a 3rd day and risk indicators continue to rise. The VIX index is currently trading 2.30% higher on Friday. The PCE Price Index rose to 2.8% annually taking the index further away from the 2% target. The chances of a rate cut by the Federal Reserve in June have fallen 12% according to the Chicago Exchange.
Trump also hinted at the possibility of stricter trade restrictions on the EU and Canada if they collaborate in opposing US trade policies. Meanwhile, newly released Q4 GDP data showed 2.4% growth, slightly exceeding the 2.3% preliminary estimate, though marking a slowdown from Q3’s 3.1% expansion.

NASDAQ - Technical Analysis
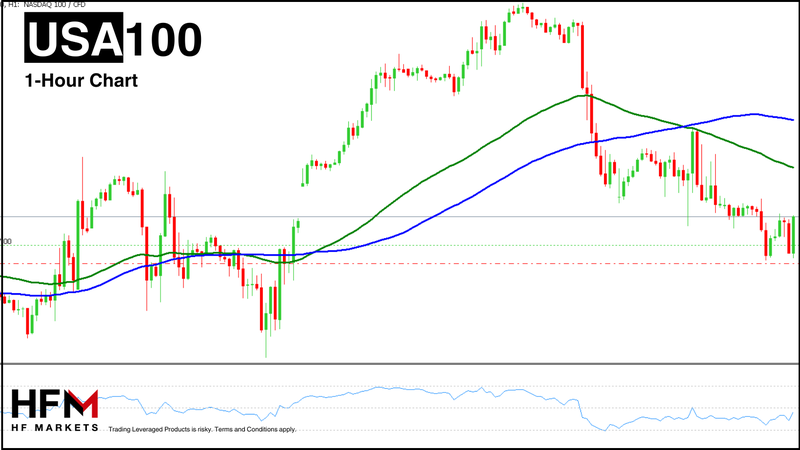
Currently, all global indices including European, UK and Asian indices trade lower due to pressure from higher inflation and the US trade policy. The Nikkei225 is currently seeing the strongest decline followed by the DAX and then the NASDA. The NASDAQ is again trading below average price movements and the VWAP. In addition to this, oscillators are also pointing lower.
Key Takeaways Points:
- The Core PCE Price Index rose 0.4%, the highest in over a year, surpassing expectations of 0.3%. This increase raises concerns about prolonged inflationary pressures.
- The higher-than-expected inflation data has fueled expectations of a more hawkish Federal Reserve, leading to a 0.35% market decline and a rise in risk indicators like the VIX index (+2.3%).
- President Donald Trump’s 25% tariff on imported cars and light trucks is set to take effect on April 2, with potential further restrictions on the EU and Canada. Fears of a trade war and rising inflation continue to weigh on markets.
- GDP growth came in at 2.4%, slightly above estimates but down from Q3’s 3.1%. Meanwhile, the PCE Price Index’s annual rise to 2.8% further distances inflation from the Fed’s 2% target, reducing the probability of a rate cut in June by 12% (Chicago Exchange data).
Terms and Conditions apply
Click here to access our Economic Calendar.
Disclaimer: This material is provided as a general marketing communication for information purposes only and does not constitute an independent investment research. Nothing in this communication contains, or should be considered as containing, an investment advice or an investment recommendation or a solicitation for the purpose of buying or selling of any financial instrument. All information provided is gathered from reputable sources and any information containing an indication of past performance is not a guarantee or reliable indicator of future performance. Users acknowledge that any investment in Leveraged Products is characterized by a certain degree of uncertainty and that any investment of this nature involves a high level of risk for which the users are solely responsible and liable. We assume no liability for any loss arising from any investment made based on the information provided in this communication. This communication must not be reproduced or further distributed without our prior written permission.


